The gradient fox system automatically monitors your Apache Kafka® clusters and collects several metrics that you can view and analyze in your web browser. These metrics are persisted so that they will be available to see long-term treding and performance analysis. The metrics are currently collected at cluster, topic and consumer levels. Each level is described in detail in the sections below.
For each metric in the system, you can select the time window that you want to inspect using the provided drop-down. You can select from a set of pre-defined time intervals starting from 30 minutes all the way up to 365 days.
All the cluster-level metrics can be found under the Metrics-tab of each cluster. Simply navigate to the cluster you want to see metrics for, and click on the tab.
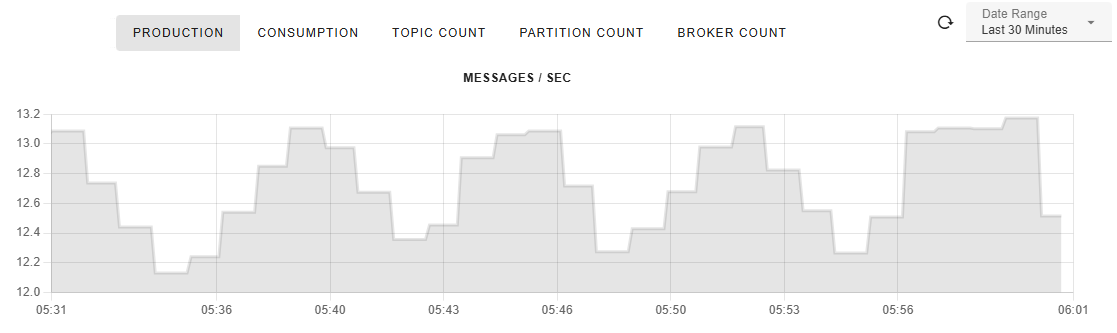
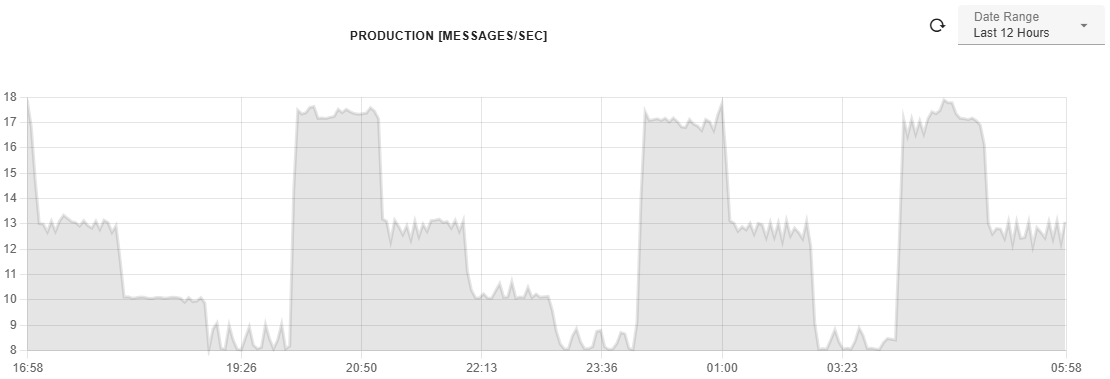
The production graph tells you how many messages per second are produced into this Apache Kafka® cluster. Basically it tells you how many messages are added per second to all topics across the entrie cluster by all producers. Using a similar example, assume you have two producers in this cluster. If producer one produces X messages per second and producer two produces Y messages per second, then at the cluster level the production is simply X + Y messages per second.
For more details on how the cluster production numbers are calculated, see the explanation here.
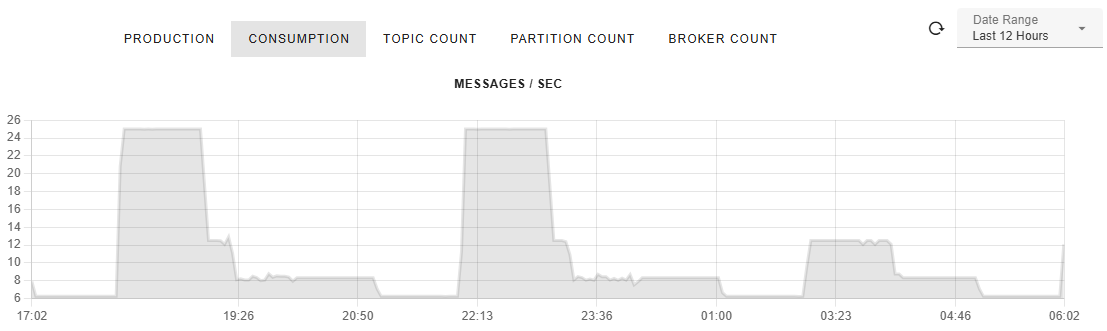
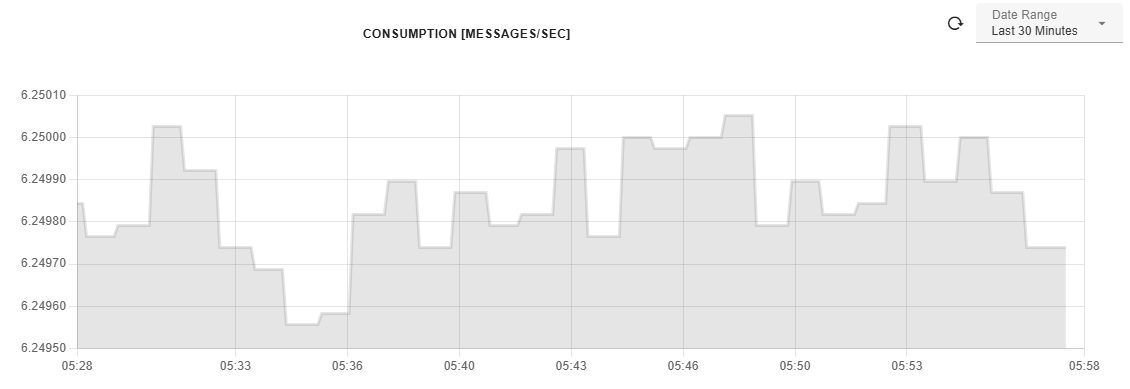
The consumption graph tells you how many messages per second are consumed from this particular Apache Kafka® cluster. For example, assume you have two consumer groups in this cluster. If consumer group one consumes X messages per second and consumer group two consumes Y messages per second, then at the cluster level the consumption is simply X + Y messages per second.
Under the Partitions-tab you can find various graphs related to partition counts. The first partition sub-graph under the Total-tab gives the total number of partitions in the cluster.
The unavailable graph shows the number of unavailable partitions in this Apache Kafka® cluster. An unavailable partition has no leader or the leader is offline. This can happen for numerous reasons, including broker failures, networking issues or a misconfiguration. When a partition is unavailable Kafka can't serve reads or writes to that partition anymore. This is serious condition, therefore you can also create Alerts for this metric to make sure you will be notified immediately when this happens.

The under-replicated graph gives the number of partitions that are under-replicated in this cluster. In an under-replicated partition not all replicas of the partition are currently in sync with the leader. In other words, some replicas are lagging behind or offline. In addition to networking and hardware failures, this can be caused by an overloaded broker - CPU, memory, or network bottlenecks are causing a replication lag.

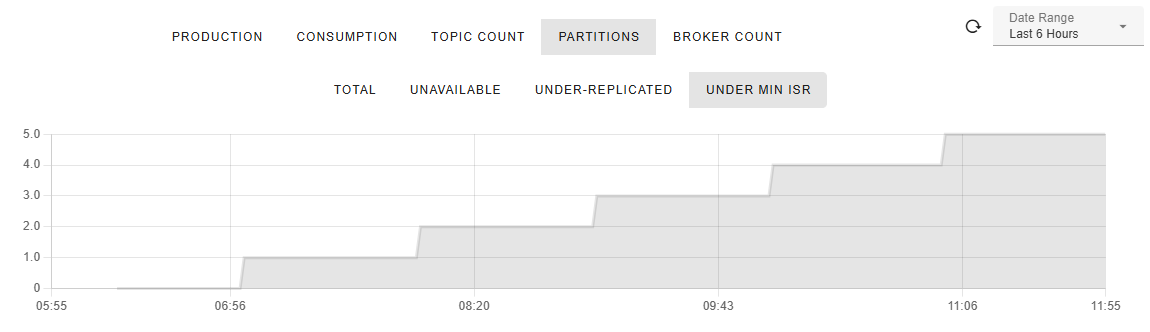
The under min ISR graph gives the number of partitions the cluster whose ISR (in-sync replicas) count is less than the value configured in the min.insync.replicas setting at the topic level. The min.insync.replicas is a setting in Kafka that defines the minimum number of replicas that must be in-sync for a producer to successfully write a message, when the producer has set acks=all. Under ideal conditions this graph should always show zero partitions, as a value greater than zero means producers will see an NotEnoughReplicasException or NotEnoughReplicasAfterAppendException exception and the writes will fail.
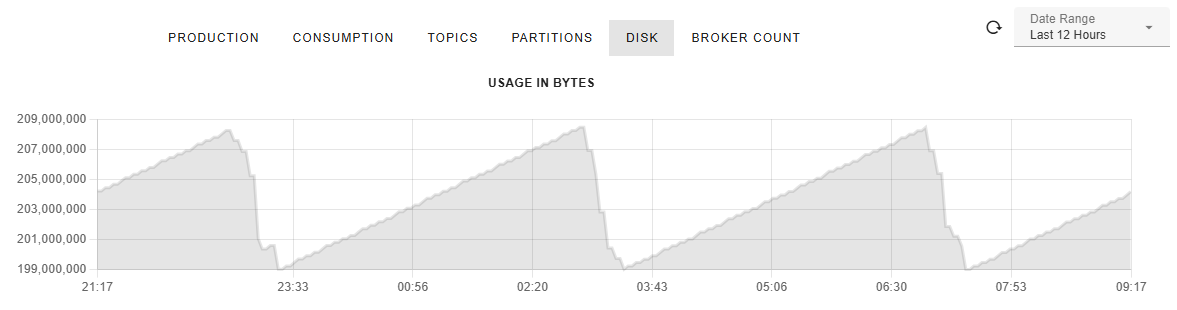
The Disk Usage graph shows the total disk usage for the selected cluster in bytes across all brokers. The total disk usage is the sum of disk usage for each topic-partition in the cluster. Notice that this information is not available for some cloud providers, you will see zero values instead.
You can find all topic-level metrics under the Metrics tab of each topic. Just navigate to your desired topic and click the Metrics tab.
The topic consumption metrics are very similar to the consumption metrics at the cluster level, the measurements are just done for one topic instead of the entire cluster. In other words, the graph tells you how many messages per second are consumed from this particular topic. For example, assume you have two consumer groups consuming from this topic. If consumer group one consumes X messages per second and consumer group two consumes Y messages per second, then for this topic the consumption is X + Y messages per second.
Topic production metrics closely resemble cluster production metrics, with the primary distinction being that they focus on a single topic rather than the entire Apache Kafka® cluster. The production graph provides insight into the rate at which messages are produced for a given topic, measured in messages per second. Specifically, it represents the total number of messages added per second across all partitions of the topic by all producers. For example, if two producers are publishing messages to the topic—one at a rate of X messages per second and the other at Y messages per second—the total topic production rate would be X + Y messages per second.
For more details on how the topic production numbers are calculated, see the article here.
The Disk Usage graph shows the disk usage for the selected topic in bytes across all brokers. Notice that this information is not available for some cloud providers, you will see zero values instead.
All the consumer group metrics can be found under the Metrics-tab of each consumer. Just navigate to your desired consumer group and click the Metrics tab.
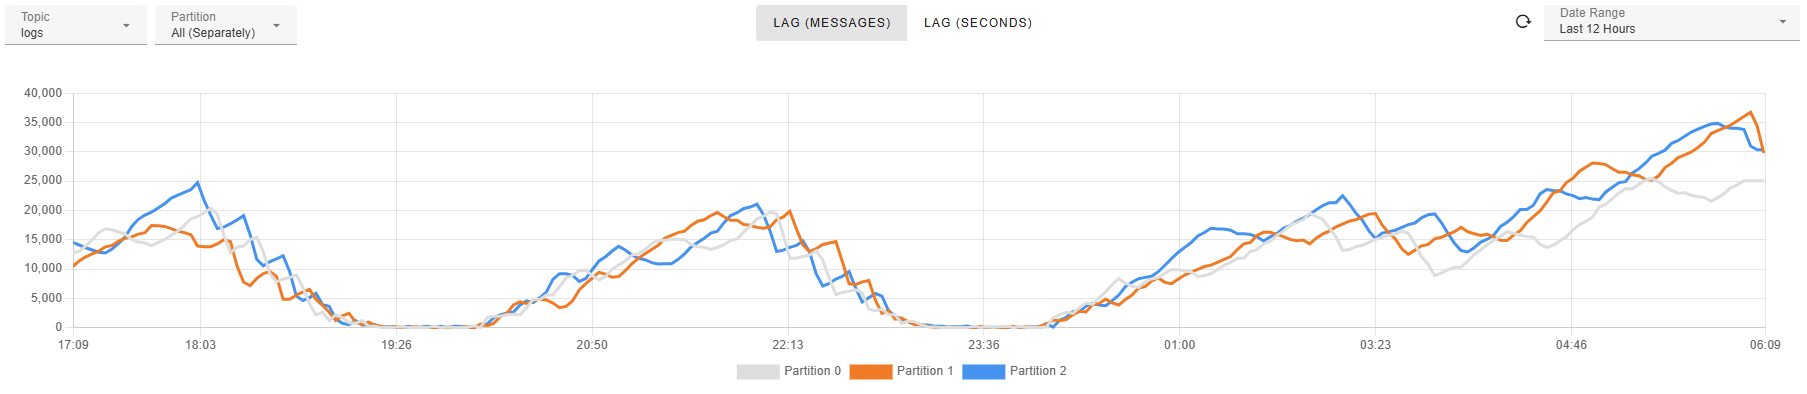
The lag(messages) graph tells you the size of the lag for this consumer, measured as the number of messages. For example, assume the consumer group consumes from two topics. If consumer group lag for topic one is X messages and the lag for topic two is Y messages, then the total lag is simply X + Y messages.
You can also view the lag for a specific topic or show the lags separately per topic by making the corresponding selection in the Topic-dropdown on the left hand side.

To see how the lag(messages) number for a consumer group is calculated, see the post here.
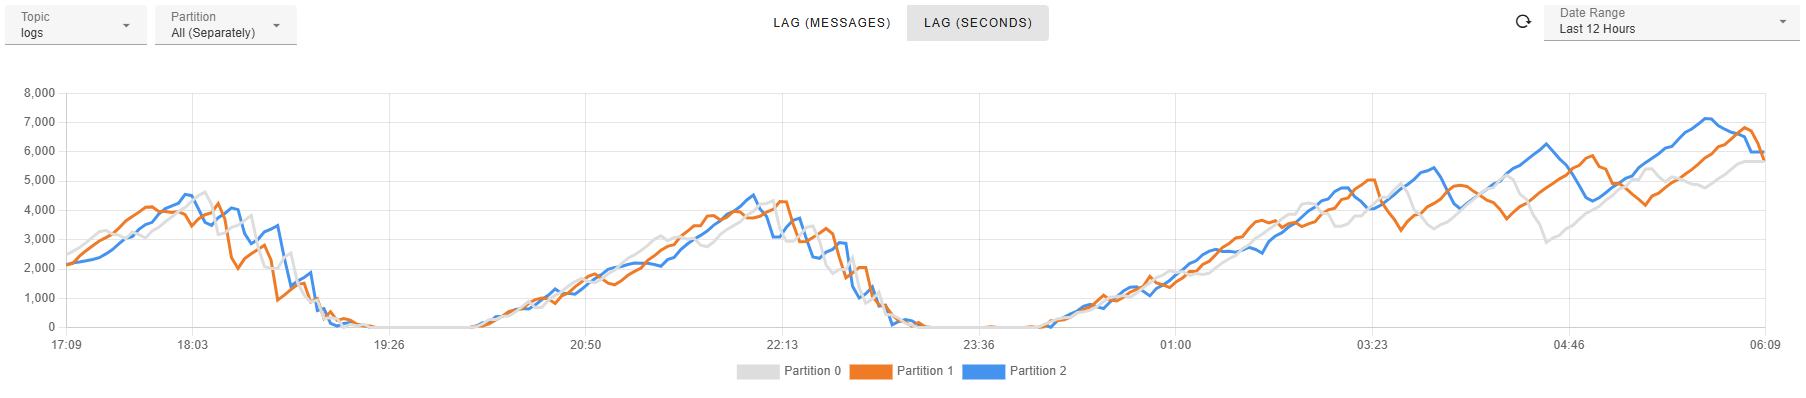
If you want to see the lag for individual partitions, this can be done by selecting a particular topic from the Topic-dropdown. This will present a new Partition-dropdown next to the Topic-dropdown. From this Partition-dropdown you can select an individual partition you want to see the consumer group's lag for.
Alternatively, you can select All(Sum) which will show the sum of all lags for the selected topic, or All(Separately) which will plot the lag for each individual partition in the topic. This is the case depicted in the screen shot below. The legend at the bottom will show you the colors for each partition. You can toggle the visibility of each partition by clicking on its colored box in the legend.
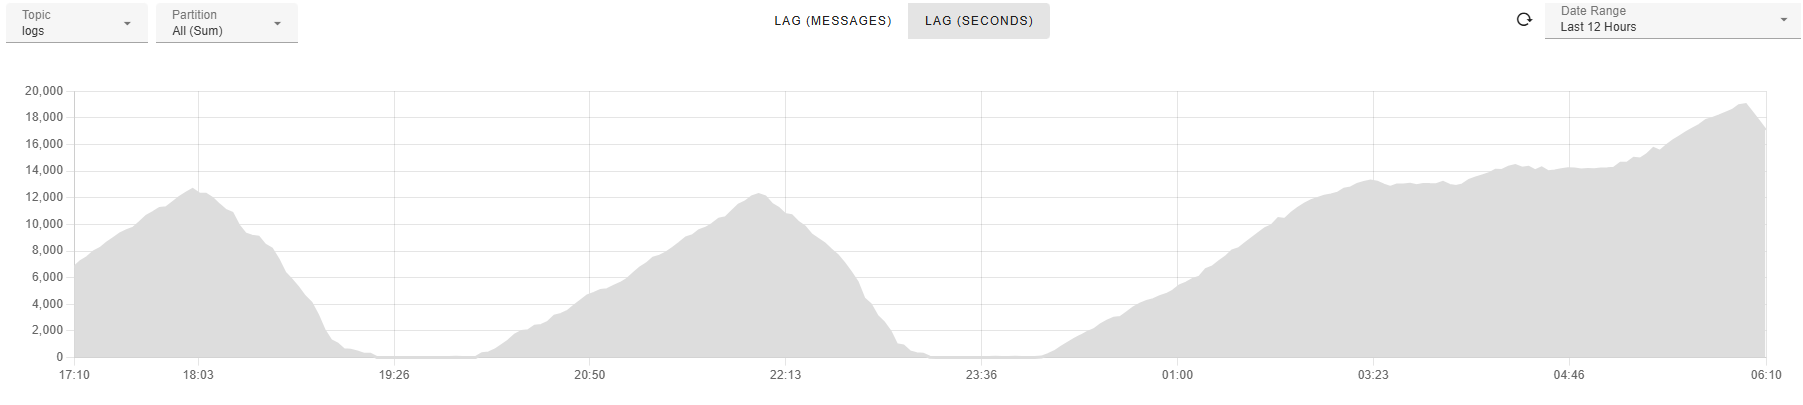
The lag (seconds) graph shows the size of the lag for this consumer group, measured as the number of seconds. For example, assume the consumer group consumes from two topics. If consumer group lag for the first topic is X seconds and the lag for the second topic is Y seconds, then the total lag is simply X + Y seconds.
You can also view the lag in seconds for a specific topic or show the lags separately per topic by making the corresponding selection in the Topic-dropdown on the left hand side.
To see how the lag(seconds) number for a consumer group is calculated, see the post here.
If you want to see the lag in seconds for individual partitions, this can be done by selecting a specific topic from the Topic-dropdown on the left. This will show a Partition-dropdown next to the Topic-dropdown. From this Partition-dropdown you can select an individual partition you want to see the consumer group's lag in seconds for.
Alternatively, you can select All(Sum) which will show the sum of all lags for the selected topic, or All(Separately) which will plot the lag for each individual partition in the chosen topic. This case is displayed in the below screen shot. The legend at the bottom will show you the colors for each partition. You can change the visibility of each partition by clicking on the colored box next to it in the legend.